Consulting Assignment Implementation
Category: Training
An consulting assignment is like a problem solving process, and consists of:
— Identifying the problem;
— Data gathering;
— Problem and issue analysis;
— Generating ideas and options;
— Making decisions;
— Action planning.
— Following up.
Identify the bottleneck (the factor that are mostly causing the problem)
— Methods / instruments to identify the cause of the problems (bottleneck)
— Method / instruments for improvement in the company
Tools for identifying problems
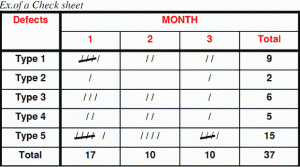
Check sheets
WHY — To allow a team to systematically record and compile data so that patterns and trends can be clearly detected and shown.
WHAT
— Creates easy-to-understand data
— Builds a clearer picture of the «facts» as opposed to opnions
— Indicates patterns in the data
HOW
— Agree on the definition of what is being observed
— Decide who will collect the data, over what period and from what sources
— Design a checksheet form that is clear, complete and easy to use
— Collect the data
— Interpret the data
Control Charts
WHY
• To monitor, control and improve process performance over time by studying variation and its source (there are many types of control charts)
WHAT
— Analyse process variation over time
— Distinguishes special from common causes of variation
— Tool for ongoing control of a process
— Helps improve a process to perform consistently and predictably
— Provides a common language for discussing process performance
HOW
— Select the process to be charted
— Determine the sampling method and plan
— Gather data
— Calculate the appropriate statistics and control limits (average, upper control limit, lower control limit) — Construct the control chart
— Interpret the chart/
There are different types of control charts depending on the type of data which is analysed
For VARIABLES DATA (anything that can be measured)
Length
Weight
Temperature
Concentration, etc.
USE:
X R (average range) control chart X S (for large sample size, > 10)
For ATTRIBUTE DATA (data obtained by counting, rather than by measuring)
Number of defects
Number of cracks
Number of absent days
Number of breakages, etc.
USE:
np chart (for constant sample size and charting number of defective units) c chart (for constant sample size and charting number of defects) p chart (for varying sample size and charting number of defective units) u chart (for varying sample size and charting number of defects)
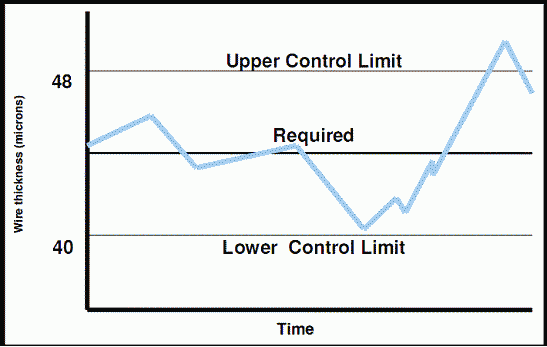
Example of Control chart:
Analyze the problem
5 Why’s 1H technique
(What?, Why?, Where?, When?, Who?, and How?
Or, define
What to change?
What to change to?
How to cause the change?
Cause and effect analysis WHY
• Identify, explore and graphically display, in increasing detail, all of the possible causes related to a problem to discover its root cause(s)
WHAT
Focus on the content of the problem, not on the history of the problem or personal interests
Involves the team which builds support for the resulting solutions
Focuses on causes, not symptoms
HOW
Problem statement
Generate the causes needed to build a cause and effect diagram (brainstorming, data collected)
Construct the diagram
Problem statement
Draw major cause categories (bones), connect them to the back-bone of the diagram: Machines, Methods, Materials, People, Policies, Measurement, Behavior, Environment, etc.)
Put the identified causes in the appropriate category
Ask repeatedly of each cause listed on the «bones» the question Why?
Interpret or test for root cause(s) (causes that appear repeatedly, selection, data on relative frequencies of the different causes)
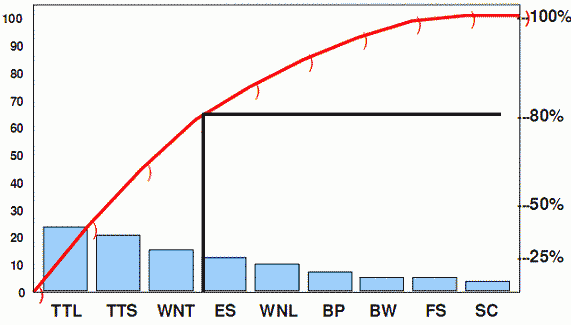
Pareto analysis
WHY
• Focus efforts on causes of problems that offer the greatest potential for improvement
WHAT
Helps to focus on biggest impact causes
Based on proven principle: 20% of sources causes 80% of the problem
Visual display of relative importance of problems
HOW
Decide what you want to analyse
Choose the causes or problems by brainstorming or from existing data
Choose the most meaningful unit of measurement (such as frequency or cost)
Choose the time period for the study
Gather the necessary data
Compare the relative frequency or cost of each problem category
List the problem categories on the horizontal line and the unit of measurement (like frequencies) on the vertical line
Draw the cumulative line showing the portion of the total that each problem category represents
Interpret the results
Generate ideas and options
Brainstorming is a technique which encourages creative thinking and the generation of ideas. Analysis and evaluation are prevented in the early stages ensuring radical and different ideas are aired.
How to use it:
Assembly the brainstorm group
Appoint a scribe and if appropriate a separate time keeper
Explain the purpose of the meeting and the ground rules. Agree a statement of the topic or issue to be brainstormed. Write this up at the top of the chart.
Allocate time to brainstorm and time to review the outputs; 5-20 minutes is usually sufficient for generating ideas, but brainstorms can go on for hours.
Agree the ground rules
Start the ideas coming — make sure that all ideas are visible to everyone in the group
The scribe should not abbreviate or interpret. It is important to capture ideas exactly as expressed
Having generated a number of ideas, you can than evaluate their usefulness towards meeting the original objective
Benchmarking (comparison analysis) is a process of learning from others as a basis for setting stretch goals, identifying breakthrough processes and accelerated improvement towards world class performance standards.
Action Planning
An action plan is an outline of tacks to be undertaken, to achieve specified objectives. It forms the basis of «getting it right first time».
Gantt Chart
Tree Diagram
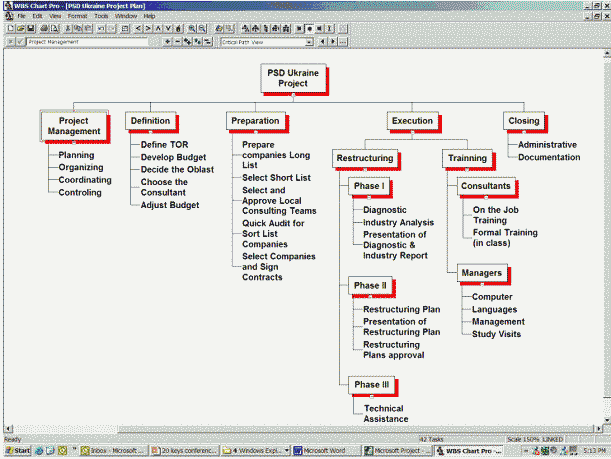
Work Breakdown Structure (WBS) — task oriented family tree which organizes, defines and graphically display the projects. Descending levels representing an increasing detailed definition of the scope (elements of the project).
Example of a Work Breakdown Structure (WBS)


