DEFAULT RISK STATISTICS
Category: Risk Management in Banking
The external ratings map to yearly and cumulated default rates, as shown below. Calculations of default rates refer to numbers of firms or are value weighted by size of defaulted issues. When calculating a default rate, it is necessary to refer to a specific number of surviving firms at the beginning of the period. The process implies the following steps:
• Aggregating default data for a given cohort of firms, defined by those firms surviving and rated at the beginning of a given year.
• Breaking down the cohort into subportfolios by rating.
• Calculating the default rate as the ratio of the number of defaults in a given period over the total of surviving firms at the beginning of the period (or a size-weighted ratio).
It is possible to aggregate cohorts across years when using larger populations.
Yearly Default Rates
Yearly default rates are ratios of defaulted firms to surviving firms at the beginning of the year. There are arithmetic default rates and value weighted default rates.
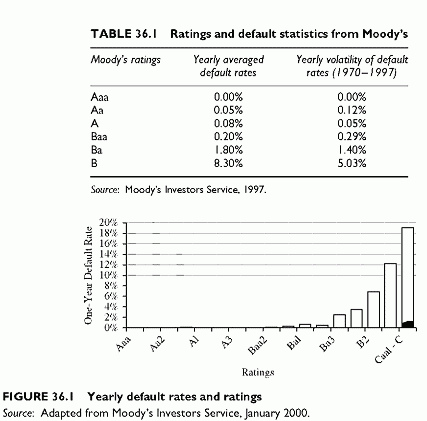
The default rates of a rating class and its volatility over time derive from these statistics. The default rates are close to zero for the best risk qualities. They increase to around 8% a year for the lowest rating class (in the six-class simplified rating scale). Table 36.1 shows the magnitude of yearly default rates for the six rating classes in Moodys simplified rating scale. Actual values vary every year. The top three ratings characterize investment grade borrowers. The other three classes are speculative grade. For investment grade borrowers, the yearly default rate is below 0.1%. For speculative grade borrowers, it ranges from
0.2% to 8% a year.
Figure 36.1 shows the characteristic shape of average default rates by detailed rating class, growing far more than proportionally for the lowest (riskiest) ratings. The increase in default rate when ratings decline has an exponential shape. The increase in default rate from one class to another changes drastically. In order to improve the rating by one grade, the required variation of default rate is around 6% for the last two classes of the
scale. At the other end of the scale, a small decrease of 0.05% suffices to improve the grade from Aa to Aaa.
Improving the rating of a bank is of major importance. Ratings drive the cost of borrowing for banks and their eligibility to participate in certain activities. Since economic capital calculation uses a confidence level that represents the default risk of the bank, the table shows that targeting investment grade ratings implies very tight confidence levels, way below 0.1%. The required improvement of solvency (default probability) required to gain one rating notch is much higher at the lower (riskier) end of the scale than at the other end. The importance of modelling the fat tail of the loss distribution follows.
Cumulative Default Rates
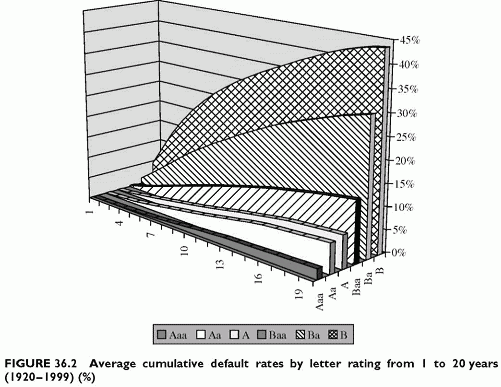
Default rates cumulate over time. Figure 36.2 shows the characteristic shapes of the default frequency time profiles by rating. The default rates increase with the horizon. The longer the period, the higher the chances of observing a default. The growth of default rates with horizon is not proportional. For high ratings, or low default rates, the increase is more than proportional. For low ratings and high default rates, it is less than proportional. High-risk borrowers improve their risk when they survive for a longer time. Low-risk borrowers face risk deterioration when time passes. All these observable facts are important to differentiate the risks across time and to value both expected and unexpected losses.
Annualized rates serve for constant provisioning across all years and up to maturity. Annualized rates are higher than yearly spot rates when rates increase less than proportionally to the horizon. The opposite holds when rates increase less than proportionally with time. If the cumulated default rate is 3.5% for 2 years, the annualized default rate is 3.5%/2 = 1.75%. It is higher than the spot default rates, for instance 2%. For a 2-year maturity exposure, the annualized default rate will be 1.75%. For a 1-year exposure, it will be higher.


