Default Rates Volatility
Category: Risk Management in Banking
Default rates are unstable when time passes. The volatility of yearly historical default rates is the standard deviation of observed time series. The volatility increases with the level of default rate, when the rating decreases. Historical volatilities are available from rating agencies for default rates observed across varying horizons. If the volatility is high, the potential deviations of the default rates around the average can be significant. If the volatility is low, deviations are small. The unexpected losses will be higher in the first case (Table 36.2).
Volatility provides a simple way to measure unexpected loss for loan portfolios. The loss volatility is the standard deviation. The expected loss is proportional to the average default rate.
The volatility of default rates supports the view of a positive correlation between default events across obligors. The Credit Metrics technical document provides a simple equation to derive the implicit uniform correlation between default probabilities of obligors within the portfolios. The underlying intuition is that the higher the correlation p, the higher the volatility of default rates because defaults trigger numerous others if correlation gets higher. The formula below provides the average default correlation p for large values of N, the number of names covered by the data, as a function of d, the average default rate over the years, and a the standard deviation of the default rates observed from year to year1:
RECOVERY STATISTICS
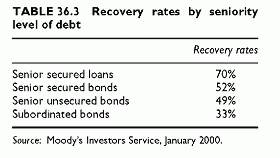
Recovery statistics are based on the prices of defaulted bonds, calculated as the ratio of the defaulted issue to its par value. Recovery rates vary by seniority levels, as shown in Table 36.3. There is a wide variation around the mean, so that the actual ranges across types of debts widely overlap. For instance, 50% of the senior subordinated bonds recovery rates are in the range 20% to 40% (rounded values), while the mean is around 33%. Moreover, recovery rates of senior secured bonds, senior unsecured bonds and senior subordinated bonds. Another empirical fact pointed out by Moodys is that recovery rates seem correlated with economic conditions. Hence, when these worsen, chances are that recoveries also do. Most models using recoveries as an input do not account for such correlations.
Recoveries are a major determinant of loss under default. Therefore, it is not surprising that the New Accord focuses on building up recovery data. Recovery data by seniority level, types of products and nature of guarantees would help differentiate more significantly average recoveries for these subclasses and cross-sections in the future.


