Interest Rate Management Procedures
Category: Risk Management in Banking
The area of interest rate risk is the second area of major concern and on-going risk monitoring and management. Here, however, the tradition has been for the banking industry to diverge somewhat from other parts of the financial sector in their treatment of interest rate risk. Most commercial banks make a clear distinction between their trading activity and their balance sheet interest rate exposure.
Investment banks generally have viewed interest rate risk as a classic part of market risk, and have developed elaborate trading risk management systems to measure and monitor exposure. For large commercial banks and European-type universal banks that have an active trading business, such systems have become a required part of the infrastructure. But, in fact, these trading risk management systems vary substantially from bank to bank and generally are less real than imagined. In many firms, fancy value-at-risk models, now known by the acronym VaR, are up and running. But, in many more cases, they are still in the implementation phase. In the interim, simple ad hoc limits and close monitoring substitute for elaborate realtime systems. While this may be completely satisfactory for institutions that have little trading activity and work primarily on behalf of clients, the absence of adequate trading systems elsewhere in the industry is a bit distressing.
For institutions that do have active trading businesses, value-at-risk has become the standard approach. This procedure has recently been publicly displayed with the release of Riskmetrics by J. P. Morgan, but similar systems are in place at other firms. In that much exists in the public record about these systems, there is little value to reviewing this technique here. Suffice it to say that the daily, weekly, or monthly volatility of the market value of fixed-rate assets are incorporated into a measure of total portfolio risk analysis along with equity’s market risk, and that of foreign-denominated assets.
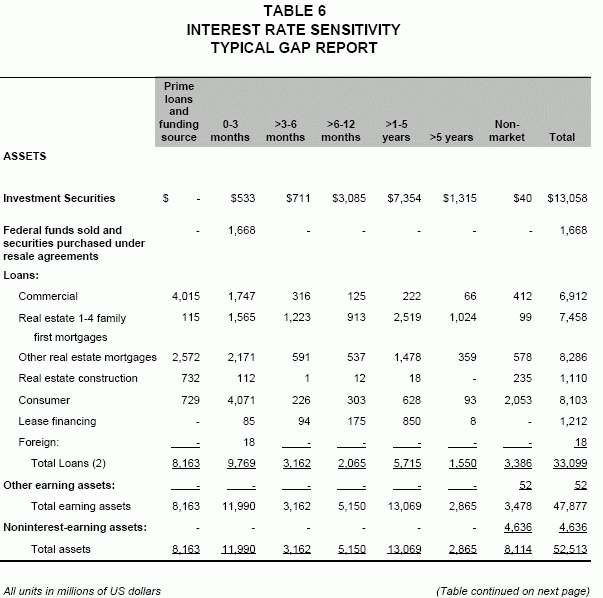
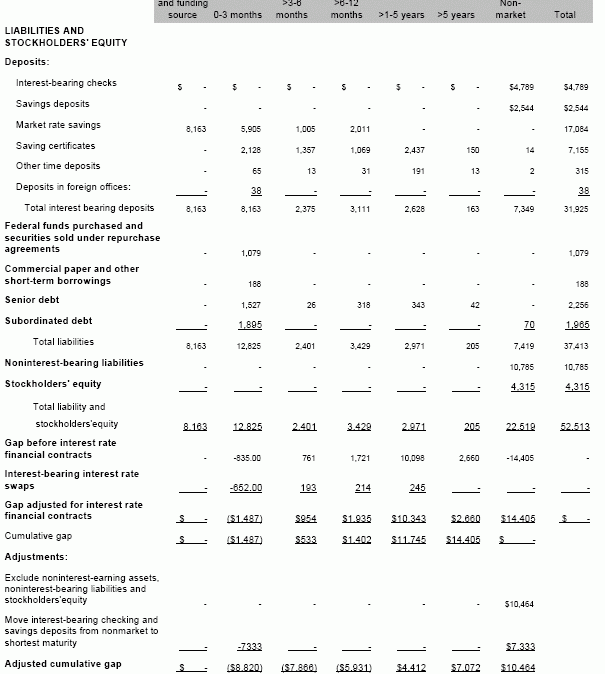
For balance sheet exposure to interest rate risk, commercial banking firms follow a different drummer — or is it accountant? Given the generally accepted accounting procedures (GAAP) established for bank assets, as well as the close correspondence of asset and liability structures, commercial banks tend not to use market value reports, guidelines or limits. Rather, their approach relies on cash flow and book values, at the expense of market values. Asset cash flows are reported in various repricing schedules along the line of Table 6. This system has been labelled traditionally a «gap reporting system», as the asymmetry of the repricing of assets and liabilities results in a gap. This has classically been measured in ratio or percentage mismatch terms over a standardized interval such as a 30-day or one-year period.
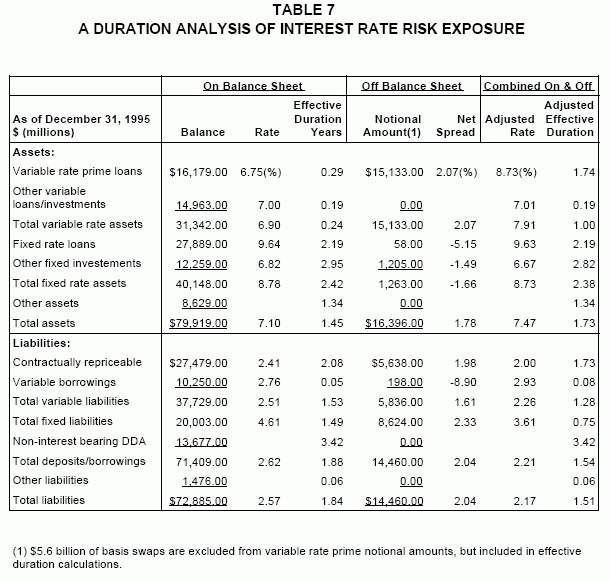
This is sometimes supplemented with a duration analysis of the portfolio, as seen in Table 7. However, many assumptions are necessary to move from cash flows to duration. Asset categories that do not have fixed maturities, such as prime rate loans, must be assigned a duration measure based upon actual repricing flexibility. A similar problem exists for core liabilities, such as retail demand and savings balances. Nonetheless, the industry attempts to measure these estimates accurately, and include both on- and off-balance sheet exposures in this type of reporting procedure. The result of this exercise is a rather crude approximation of the duration gap.
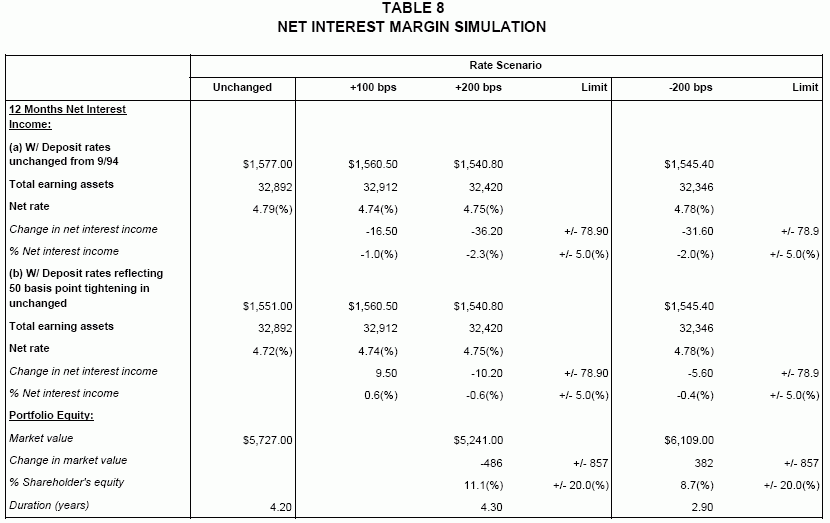
Most banks, however, have attempted to move beyond this gap methodology. They recognize that the gap and duration reports are static, and do not fit well with the dynamic nature of the banking market, where assets and liabilities change over time and spreads fluctuate. In fact, the variability of spreads is largely responsible for the highly profitable performance of the industry over the last two years. Accordingly, the industry has added the next level of analysis to their balance sheet interest rate risk management procedures. Currently, many banks are using balance sheet simulation models to investigate the effect of interest rate variation on reported earnings over one-, three- and five-year horizons. These simulations, of course, are a bit of science and a bit of art. They require relatively informed repricing schedules, as well as estimates of prepayments and cash flows. In terms of the first issue, such an analysis requires an assumed response function on the part of the bank to rate movement, in which bank pricing decisions in both their local and national franchises are simulated for each rate environment. In terms of the second area, the simulations require precise prepayment models for proprietary products, such as middle market loans, as well as standard products such as residential mortgages or traditional consumer debt. In addition, these simulations require yield curve simulation over a presumed relevant range of rate movements and yield curve shifts.
Once completed, the simulation reports the resultant deviations in earnings associated with the rate scenarios considered. Whether or not this is acceptable depends upon the limits imposed by management, which are usually couched in terms of deviations of earnings from the expected or most likely outcome. This notion of Earnings At Risk, EaR, is emerging as a common benchmark for interest rate risk. However, it is of limited value as it presumes that the range of rates considered is correct, and/or the bank’s response mechanism contained in the simulation is accurate and feasible. Nonetheless, the results are viewed as indicative of the effect of underlying interest rate mismatch contained in the balance sheet. Reports of these simulations, such as contained in Table 8, are now commonplace in the industry.
Because of concerns over the potential earnings outcomes of the simulations, treasury officials often make use of the cash, futures and swap markets to reduce the implied earnings risk contained in the bank’s embedded rate exposure. However, as has become increasingly evident, such markets contain their own set of risks. Accordingly, every institution has an investment policy in place which defines the set of allowable assets and limits to the bank’s participation in any one area; see, for example, Table 9. All institutions restrict the activity of the treasury to some extent by defining the set of activities it can employ to change the bank’s interest rate position in both the cash and forward markets. Some are willing to accept derivative activity, but all restrict their positions in the swap caps and floors market to some degree to prevent unfortunate surprises.
As reported losses by some institutions mount in this area, however, investment guidelines are becoming increasingly circumspect concerning allowable investment and hedging alternatives.


