RISK-BASED PERFORMANCE, PRICING AND CAPITAL ALLOCATION
Category: Risk Management in Banking
Ex post measures use absolute risk contributions and serve for risk-return monitoring of the existing portfolio (ex post view). Ex ante measures use marginal risk contributions and serve for risk-based pricing (ex ante view).
Using marginal risk contributions makes pricing sensitive to the entrance order in the portfolio. The same facility entering first and second requires a different pricing to obtain a given target overall portfolio return, as explained when discussing risk contributions. However, whatever the entrance rank, risk-based pricing achieves the target overall rate of return over the entire portfolio. The same simple example of a two-obligor portfolio used for illustrating risk contribution properties now illustrates RaRoC calculations, with and without a new facility. After a reminder of the example data, we proceed with the calculations of the ex post risk-based performance and the ex ante risk-based pricing using a target required return on capital.
TheSamplePortfolio
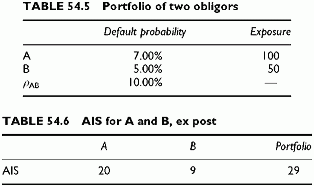
The portfolio of two obligors of Chapter 46 (with 10% correlation) is as shown in Table 54.5. We now add revenues as annualized AISs, or interest margins plus any fee averaged over the life of the transaction in Table 54.6.
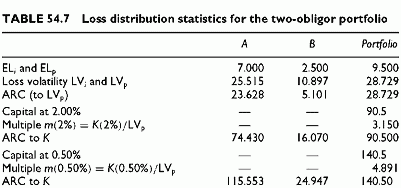
We conducted all detailed calculations to obtain the loss statistics of the portfolio and allocate the capital and loss volatility to each of the two obligors. A summary is given in Table 54.7. There are two cases for economic capital, using the confidence levels 2%
and 0.5%.
To conduct risk-adjusted performance analysis, we need existing revenues. To conduct a risk-based pricing calculation, we need to calculate the required revenues. The first case considers revenues as given (ex post view), while the second case determines the required revenues in line with target profitability (ex ante view).
Risk-based Performance
Risk-based performance is an ex post measure showing, given past pricing decisions, what are the relative performances of business lines, facilities and so on. All that remains to do is
Risk-based Pricing
Risk-based pricing implies pricing according to risk. The starting point becomes the required hurdle rate, set at 20% pre-operating expenses and pre-tax. Then we move to the required revenues that meet this target. The difference with the previous RAPM calculation is that we use the marginal risk contribution to capital, or MRC(K), rather than the absolute risk contribution. We show numerically here several implications: the pricing is not the same, using the unique 20% hurdle rate, when we use absolute or marginal contributions; the pricing depends on the order of entrance into the portfolio; the ex post portfolio RaRoC is in line with the target rate. In order to do so, we need to make a distinction between the events A first-in and B first-in.
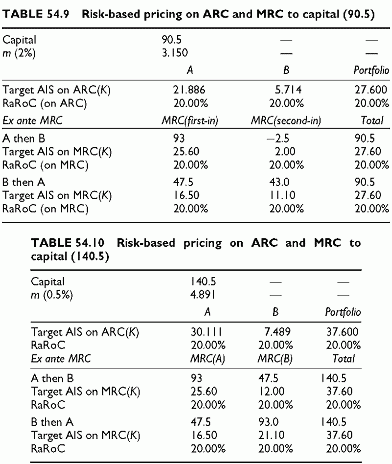
Tables 54.9 and 54.10 show two calculations, the first with a capital of 90.5 (2% confidence level) and the second with a capital of 140.5 (0.5% confidence level).
Table 54.9 presents the absolute and the marginal risk contributions of A and B, both when A is first-in and when B is first-in. It shows the values of the required AIS based on both absolute and marginal risk contributions.
The obvious observation are: the target AIS differs when using absolute and marginal risk contributions; the target AIS of A and B also depend, when using marginal risk contributions, on which facility is the first-in the portfolio. Nevertheless, in all cases, the RaRoC is always equal to the target rate 20%, simply because the AIS are derived under this constraint. Calculations differ by their meaning. For risk-based pricing, only marginal risk contributions combined with the hurdle rate count. Note that the absolute risk contributions are unknown before a new transaction is selected, since this new facility changes all of them.
However, it is useful to check that the overall return on capital remains 20%. It is also necessary to see what are the absolute risk contributions after entrance of both exposures into the portfolio. The table summarizes all information.
From an ex ante view, we have to consider a first entrant and then a second one to build up the portfolio. When A enters first and then B, we require a high AIS on A (25.60) and a low AIS on B (2.00) to get the overall 20% return, because of diversification. The example shows that the entrance order changes the marginal contribution of A, or of B, as well as the target AIS. The same transaction, A, requires a different pricing depending on the order of entrance. If transaction A is first-in, it requires a 25.60 AIS and if the same transaction A is second-in requires only 11.10. Still, in both cases we always end up with the overall 20%. All marginal risk contributions to capital sum to the portfolio capital, 90.5, after all transactions are in, by construction. Therefore, necessarily, the sum of the excess spread over expected loss remains 20% of that capital, or 20% x 90.5 = 18.10. The sum of the gross AIS is 27.60. The difference between the sum of the excess spreads and the sum of the AIS is the sum of the EL, or 9.50.
The AIS that would be required using the absolute risk contributions is in the top section. It differs from the AIS required based on marginal risk contributions, because absolute and marginal risk contributions differ radically. However, the AIS values sum to 27.60. This is necessary, since absolute risk contributions sum to capital. Even though they comply with this overall ex post constraint, the required AIS on absolute risk contributions would not guarantee that the portfolio return remains at 20% during its build-up, while the marginal contributions do so.
Note that simple relationships would not hold when using marginal contributions to portfolio loss volatility rather than marginal contributions to portfolio capital. The reason is that the ratio of capital to loss volatility differs substantially when the first-in enters and when the second-in enters.
The second calculation (Table 54.10) uses the 0.5% confidence level, with a capital of 140.5. This calculation illustrates the case where all marginal risk contributions are positive. In this case, the marginal risk contributions to capital are identical for the first-in transaction (93.0), independent of whether it is A or B. Nevertheless, the marginal risk contributions between first-in and second-in always differ. Consequently, the required AIS for A and B changes, depending on which one is first-in. Of course, the overall portfolio RaRoC remains at 20% during the build-up period and after.
Portfolio Reporting
Three chapters address portfolio credit risk reporting. This first chapter details the specifics of a sample portfolio and provides an overall reporting on its risk-return profile. This is the top management view of the banks portfolio. The second chapter slices the portfolio along various risk and business dimensions. The risk dimensions are the various credit risk components, such as exposures, default probabilities and recoveries. The business dimensions refer to the usual product families, market segments and business lines. Reporting requires breaking down the portfolio along these dimensions, to provide the various management views of the portfolio as an aid to business decisions. The third chapter goes beyond these descriptions towards more analytical reports, such as sensitivity and what if analyses.
This chapter provides the portfolio overview using a sample portfolio. The portfolio description is given in the appendices. The major characteristics are: 50 obligors, uniform loss correlation of assets of obligors, two risk classes of default probability, two business units and two industries, unequal exposures and various loss given default percentages. Monte Carlo simulation generates the loss distribution using the simplified asset value model.
The portfolio overview through portfolio models provides a number of portfolio characteristics of interest. They include notably: the expected loss, the portfolio capital, the overall portfolio Risk-adjusted Return on Capital (RaRoC) and Shareholders Value Added (SVA), plus measures of correlation risk and concentration risk. The correlation risk measure is simply the ratio of a measure of overall risk, such as the loss volatility, to the sum of standalone risks of individual transactions, a percentage lower than 1 showing the overall gain from diversification. The size concentration risk addresses pure size discrepancies, summarized in adequate indexes, or with curves showing the percentage of the overall portfolio risk resulting from the largest exposures.
The first section describes the portfolio. The second section summarizes the portfolio overview, with overall statistics such as expected loss, capital and the aggregated portfolio RaRoC. The third section provides additional measures of portfolio concentration risk. The last section is a short transition towards the detailed views of individual facilities of the next chapters.


