REPORTING RISK-RETURN VERSUS BUSINESS DIMENSIONS
Category: Risk Management in Banking
Our sample reports use industry and business units as management dimensions and grouping criteria, cross-tabulated with risk and return measures. Using industry and business units we show risks and performance. The risk dimensions include:
• Exposure, using the sum of values for aggregation.
• Capital, using the sum of values for aggregation.
• EL%, using the arithmetic average value in each cell (the exposure weighted average is also suitable).
• Edf%, using the arithmetic average value in each cell (the exposure weighted average is also suitable).
• Lgd%, using the arithmetic average value in each cell (the exposure weighted average is also suitable).
The performance dimensions are risk-adjusted:
• RaRoC%, using the arithmetic average value in each cell (the exposure weighted average is also suitable).
• SVA in value, using the sum of values for aggregation.
Tridimensional representations allow us to show risk or return vertically, aggregated or averaged, for industries A and B versus business units V and W, in the horizontal dimensions. OLAP multidimensional capabilities are valuable from a business standpoint since they allow us to shift from one view to another and drill down in aggregates to understand which are the sources contributing to the risk or performance aggregated measures.
All figures are self-explanatory, mentioning the variables and whether they are aggregates or arithmetic averages. They are illustrations only. Actual reports would be generated
with OLAP techniques, using any type of combinations, allowing us to slice the portfolio across any dimension, or drill down in aggregates to find transaction subsets or averages of risk or return, and allowing us to identify dynamically on a front-end which transactions contribute more to risk and return, for example.
Highlighting the risk concentrations and the performances along various management dimensions suggests the path to follow to find the whys of the difference, paving the way directly for management issues and policies. The reports illustrate the multidimensional nature of the portfolio analysis. Segments other than those defined could also be used to deal with such issues as setting limits, setting target revenues, reallocating resources, restructuring the portfolio and so on. Further analysis, such as what if simulations, trading-off exposure from one segment to another to improve the risk-return profile, and optimization would all contribute to the enhancement of the risk-return profile of the portfolio.
Exposures and Capital by Portfolio Segments
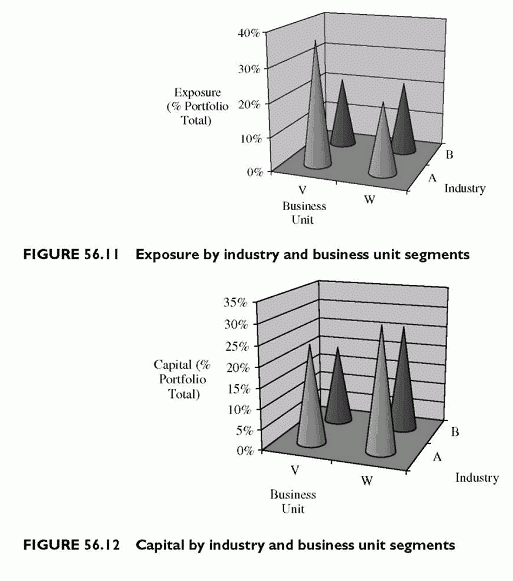
The charts show that the ranking across business units and industries differs when using as risk metric exposure weights or capital weights (Figures 56.11 and 56.12).
Risk Components by Industry-Business Unit Segment
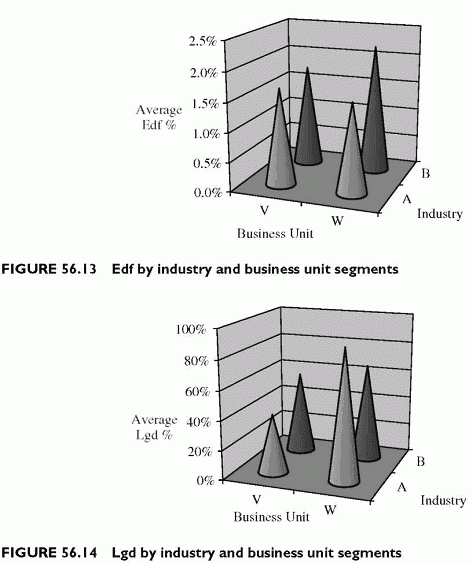
The graphs suggest that higher averaged Edfs correlate with higher averaged Lgds in percentage terms. Checking whether this is an averaging effect or not requires using the scatter plots of Edf versus Lgd in percentage terms (Figures 56.13 and 56.14).
Economic Measures of Risk (EL and UL) by Industry-Business Unit Segments
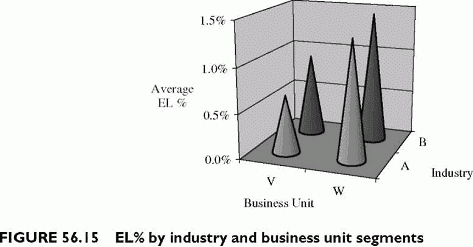
Figure 56.15 shows how EL as a percentage varies across the portfolio segments. The LV, as a percentage of exposure, has a similar pattern as EL%, because LV and EL depend on the same risk components. The graph shows clearly a higher economic risk in the W business unit across industries, which suggests drilling down to the Edf and Lgd underlying drivers to find out why this pattern appears.
Performance Reports
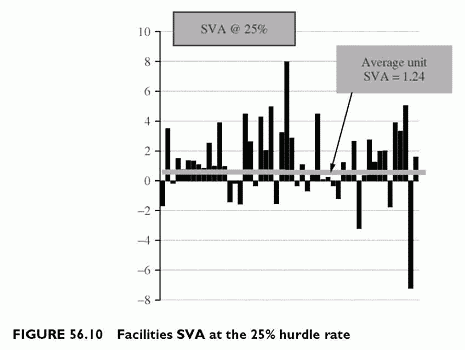
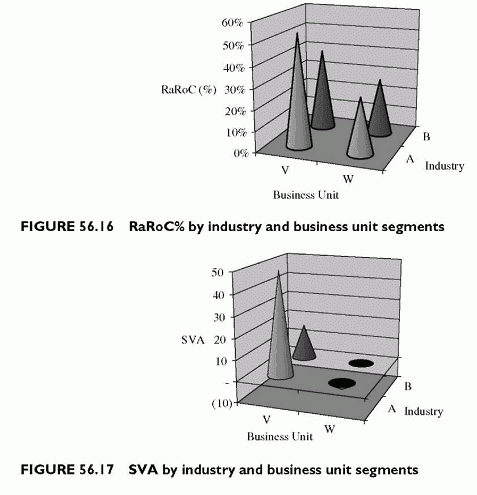
The RaRoC graph shows the W business unit to have a lower risk-adjusted performance across both industries, with a lower than hurdle rate averaged RaRoC, and a slightly negative SVA. For RaRoC, the 25% plane provides the target minimum value, while for SVA it is the zero SVA plane. Most of the created value comes from the Industry A-Business Unit V portfolio segment (Figures 56.16 and 56.17)
Portfolio Applications
This chapter details portfolio applications beyond descriptive reports. Its scope extends over three topics:
• Risk-based limits or economic limits of risk resulting from a deterioration of the risk-adjusted performance when the exposure size grows.
• Sensitivity analyses serve to determine to which risk drivers the portfolio risk is most sensitive.
• Risk-return optimization shows how to trade-off risk across exposures to enhance the overall portfolio return. There is potential for enhancement because income is proportional to size while risk is not.
The three sections illustrate these issues.

