BLOCK II: PORTFOLIO RISK
Category: Risk Management in Banking
Portfolio credit risk aggregates individual risks. Unlike market risk, where risk factors are market parameters readily observable, credit risk modelling faces unobservable credit risk drivers, making it necessary to model the underlying factors that drive the credit standing of obligors. Unlike market portfolio losses, which are observable, there is no way to back test credit risk portfolio losses because there is still very little data on such distributions of losses. Although the same basic principles inspire the models, with correlation modelling and generating loss distributions, the techniques differ significantly.
Credit Risk Correlation Modelling
The correlation building block of modelling portfolio credit risk is critical. Casual observation indicates that defaults are more numerous when economic conditions worsen. The observation suggests a positive correlation between default events. Moreover, models show that the loss percentiles measuring the VaR for credit risk are highly sensitive to correlations. Underestimating them would be misleading in terms of capital required to absorb portfolio losses. Note that correlations also apply to migration events in that migrations towards lower ratings are more frequent when economic conditions worsen, just as default rates increase. This is a most challenging conceptual issue, since the observation of joint default events does not happen often. The likelihood of joint default of any two well-established firms is in fact unobservable! The only way to address the correlation issue is therefore to model default events and to infer from the modelled events their joint probability of occurrence.
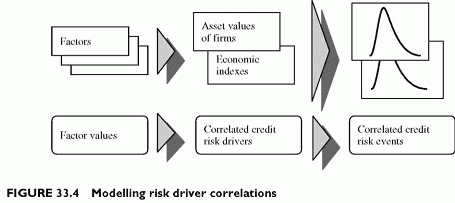
The correlation building block uses multi-factor models to derive the correlations between the drivers of modelled default events. Such drivers are the asset values of firms under the option theoretic approach and economic factors under the econometric technique. These models make the credit risk drivers dependent on a common set of factors. Since they depend on common factors, they vary in association (Figure 33.4).
Modelling Default as an Option
Under the option theoretic approach of default as a put option, the factors driving the defaults are the asset values of firms. Default occurs when asset value falls below debt value. Therefore, correlated asset values trigger correlated default events. This principle applies in KMV Portfolio Manager. Credit Metrics uses the same principle, but uses correlation between equity returns as proxies of correlations of asset returns. In addition, Credit Metrics proposes to use joint migration matrices, providing the joint probabilities that apairoffirmsinagivenpairofriskclassesmigratestoany otherpair ofrisk classes. One final class is the default state. Such joint migration probabilities increase with correlations. The dependence of asset returns or equity returns on a common set of factors generates the correlations.
Econometric Approach
The econometric approach of default rates modelling focuses on the relationship between the default rates of portfolio segments and the industry-country conditions. The technique is straightforward. The model uses a first direct logit relation between default rates of portfolio segments and an economic index, which depends on the industry-country economic variables. Since the default rates of different segments depend on a common set of factors, they tend to vary together when these factors change, thereby generating correlations between default rates.
Vendors Models and Correlations
Other models take correlations as given, without modelling them directly, such as CreditRisk+ (Credit Suisse, 1997). The model applies to portfolio segments, as CPV does. The expanded version uses sensitivities of segment default rates to external factors. The direct connection between default rates and factors generates correlated default rates by segment. However, CreditRisk+ requires end-users to define such a relationship. By contrast, KMV Portfolio Manager and Credit Metrics provide the correlations. CPV provides a framework for modelling both default rates and correlations, but also leaves it to end-users to perform the necessary statistical fits, with end-user-selected variables.
Modelling Loss Distributions
The modelling of loss distributions for portfolios and credit risk is a direct result of correlation modelling in most cases. The VaR methodology necessitates the loss distribution in order to get the loss percentiles measuring capital and VaR. The fat tail of the distribution is critical since this is where large losses appear. Unfortunately, fat tails are difficult to model with accuracy. There are several techniques for modelling loss distributions:
• Using analytical loss distributions, under restrictive assumptions.
• Monte Carlo simulation of credit risk drivers and credit events.
• Modelling all joint transitions of all firms to all states including the default states, using the pair risk correlations.
Analytical Loss Distributions
The analytical approach specifies a parametric loss distribution under a restrictive set of assumptions. CreditRisk+ is the most accomplished example. It is a default model that ignores migrations. It builds on actuarial insurance modelling to specify an analytical loss distribution resulting from the loss distributions of all portfolio segments, plus their eventual dependence on a common set of external factors. The benefit is that the loss distribution is easy and fast to compute. Nevertheless, CreditRisk+ makes simplifying assumptions to obtain an analytically tractable loss distribution and leaves it to the enduser to specify such key inputs as sensitivities of defaults to external factors.

