THE CALCULATION OF RAROC AND SVA FOR CREDIT RISK
Category: Risk Management in Banking
This section provides sample calculations of RaRoC and SVA using as inputs: interest income and fees measured as an All-In Spread (AIS); expected loss; capital, either regulatory or economic, obtained as a risk contribution from the capital allocation system; operating costs. The calculations apply to a single period. The presentation organizes the calculations into economic income statements. Both RaRoC and SVA formulas are those discussed previously. There is a hurdle rate, set at 20% before tax, to calculate the charge for capital in SVA calculations and compare RaRoC to this minimum threshold target return.
Calculation of RaRoC and SVA
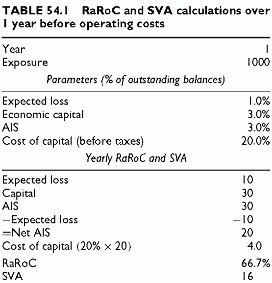
Table 54.1 details a sample calculation. Simplifying assumptions are used. The horizon is 1 year. The loss is identical to exposure (zero recoveries), the AIS is 2% of exposure, the expected loss is 1%, and the economic capital is 3%. The economic capital represents a risk contribution. The cost of capital is the required return on equity, or 25% pre-tax. Finally, this is a pre-operating cost calculation.
Since RaRoC is above 20%, the SVA is positive. However, the RaRoC is pre-operating costs. However, the hurdle rate is post-operating costs and pre-tax. With pre-operating costs earnings, it should be higher than 20%. Such earnings are contributions margins.
The Economic Income Statement
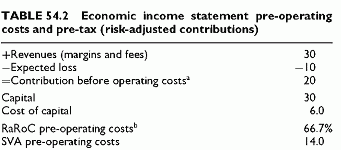
The economic income statement, based on the economic measures of expected and unexpected losses, summarizes the above calculations. There are two income statements, one truncated as above before cost allocation and another post-operating costs (Table 54.2).
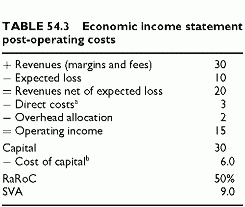
In Table 54.3, operating costs are 5. They include direct costs and overheads. The operating income nets them from revenues before calculating RaRoC and SVA.


