SENSITIVITY ANALYSIS
Category: Risk Management in Banking
Various sensitivity analyses apply to portfolios. To proceed on an orderly basis, we need to refer to a unique base case, and change only one variable at a time. For instance, we can change As exposure from 100 to 110, then revert to the 100 value for A and change Bs exposure from 50 to 55, then revert again to the base case, and change another variable. Several variables are of interest, such as the default probabilities, since they result from judgmental ratings making stress testing useful. In addition, a sensitivity analysis requires us to focus on some relevant variables, such as the portfolio loss volatility, the capital or the RaRoC of the portfolio.
Changing the values of inputs changes the values of the output variables. First, since there are several changes to consider, the number of runs can increase quickly. It is necessary to restrict the number of simulations and what if runs for easy interpretation. Fortunately, there is no need to consider unrealistic values for inputs, and we can restrict them to the range of feasible values. Second, the influence on the target variable can be large or small. Ranking inputs according to the change in target variables is a standard practice for limiting the number of inputs to critical ones that have the most important effect on the target variables.
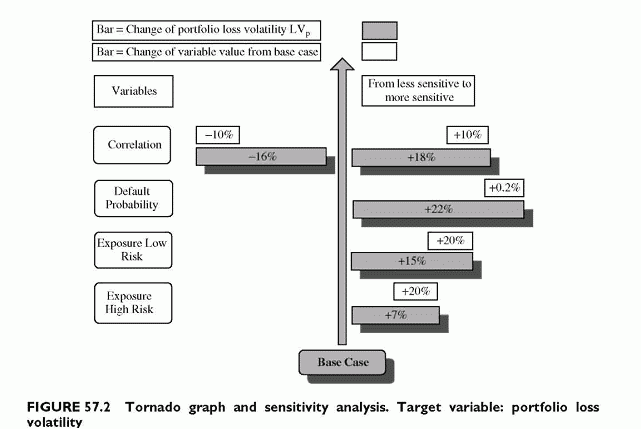
A convenient representation of this type of analysis is the so-called tornado graph. A tornado graph visualizes, for a given target variable, such as the portfolio loss volatility, the influences of given variations of the inputs. Once a range of variations of an input is given, the variations of the target variable appear ranked from largest to smallest. On top of the tornado, large bars represent the largest changes generated by the input variations to which the calculated variable is the most sensitive. Moving down, the sensitivity decreases and the bar gets shorter, providing the tornado image. Critical inputs are on top. In the graph of Figure 57.2, the portfolio loss volatility is sensitive to the exposure of A, to
the default probability of A and to the default correlation, the other variables being less critical (given the ranges of variations considered).

