PORTFOLIO OVERVIEW
Category: Risk Management in Banking
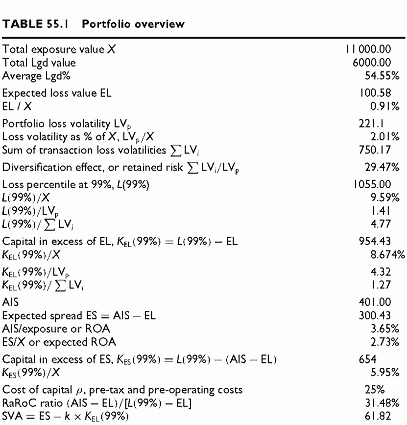
The portfolio overview provides some basic aggregated characteristics of the risk-reward profile. Table 55.1 summarizes some of these aggregated characteristics. The loss given default percentages have a direct and very significant effect on losses, but exposures serve to normalize the data since the spreads are exposure-based.
Loss Statistics and Capital
The definitions used in the calculations below are self-explanatory. The expected loss is 101, or 0.91% of exposure. It is lower than the default probabilities, 1% and 2.5%, because of recoveries. The loss percentile L(99%) is 4.77 times the sum of transaction standalone volatilities, while it is only 1.41 times the portfolio loss volatility LVp because of the diversification effect. As a reminder, L(99%) with a normal distribution would be 2.33 times the portfolio loss volatility, in between these two values, the higher multiple 4.77 illustrating the effect of the fat tail and the lower multiple 1.41 measuring the effect of diversification. This shows that normal distribution multiples have finally comparable orders of magnitude to those of the actual correlated loss distribution because the fat tail effect and the diversification effect compensate to some extent.
There are three possible calculations of capital: as a loss percentile at 99%, or L(99%); as a loss percentile in excess of expected loss, or KEL(99%); as a loss percentile in excess of expected spread, or KES(99%). Their respective values as a percentage of total book value exposure X are 9.59%, 8.67% and 5.95%. The smaller value considers that revenues in excess of expected loss are available to absorb unexpected losses.
Portfolio Risk-Return Profile
The AIS is the annualized revenue from each obligor, including interest margins and fees, both upfront flat fees and recurring fees. The latter should be averages over the maturity of the facility, based on expected values of exposures. The exposures are current or expected. The aggregated contractual spread, or total AIS under no default, is 401, while expected loss is 101. The expected spread is the contractual AIS minus the EL, or 401 — 101 = 300 (rounded value). The overall RaRoC over capital in excess of expected loss, or KEL(99%) is:
The SVA is the difference between the AIS and the EL, and the cost of the economic capital of the portfolio, pre-tax and pre-operating costs, set at 25%. Since RaRoC = 31.48% > 25%, the SVA is positive and equal to 62 (rounded). The expected spread ES increases the RaRoC numerator, while decreasing the denominator. The accounting ROA is not risk-adjusted, and is the contractual AIS divided by the total exposure, 401/1055 = 3.65%. It is much lower than the Sharpe ratio of 31.48%. The wide gap illustrates the magnitude of differences between economic and accounting measures.
