IT ISSUES
Category: Risk Management in Banking
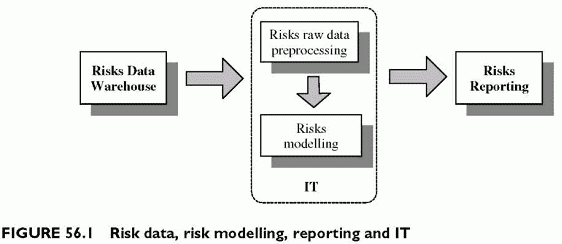
Risk information has several characteristics making risk data management a serious challenge: risks are multidimensional, they need interactive investigation by end-users and require moving back and forth from synthetic Value at Risk (VaR) to underlying sources of risk. Identifying the sources of risk conditions the ability to hedge risks, since we cannot hedge directly synthetic metrics combining entangled dimensions. Risk management processes require adequate risk data warehouses, integration of models and interactive front-ends for monitoring risk. IT plays a key role in implementing the entire risk process and provides the necessary interface for data gathering, running models and reporting through interactive front-ends with end-users (Figure 56.1).
Credit risk information is a complex set of data. The risk data warehouse is a dedicated database for collecting all risk data in order to analyse it. On-Line Analytical Processing (OLAP) and data mining allow us to perform these analyses along the multiple dimensions relevant for monitoring risk, identifying its sources, detecting patterns across transactions and providing all reports for conducting business.
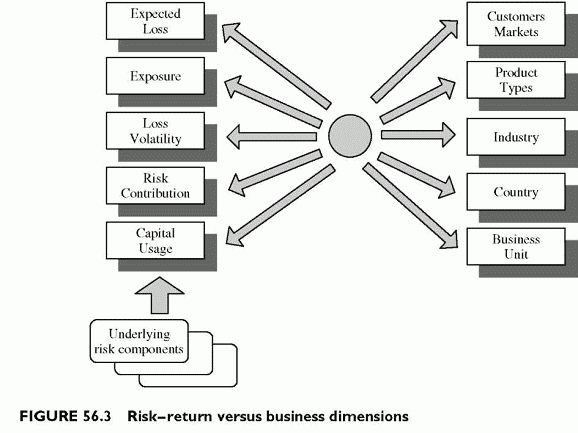
The criteria for slicing a banks portfolio are multiple: excess utilization over risk limits, transaction data for risk assessment purposes and preparing credit risk decisions, cross-sectional data by country or rating, or any other relevant dimension, in addition to the usual business views such as customers, products and business units. Moreover, modelling adds new metrics to classical measures, such as economic values of exposures, expected and unexpected losses, capital and so on. This magnifies the number of dimensions of risk to deal with for management purposes. It becomes critical to handle all of them, and to have useful views along all relevant dimensions and risk metrics.
Multiple dimensions magnify the need for filtering the data interactively. Reports provide views on risk and return, and raise issues such as why risks are high or low in portfolio segments, or why mispricing is so important in some business segments. These findings inspire new investigations, making data mining interactive for end-users. Interactivity is necessary whenever the search for new information depends on previous findings suggesting new investigations. Examples abound. Discovering a new excess exposure over limits necessitates understanding why such excesses appear. They might result from new transactions, or simply from the risk drift of existing transactions. Corrective actions depend on the sources of excess risks. Risk management is event-driven.
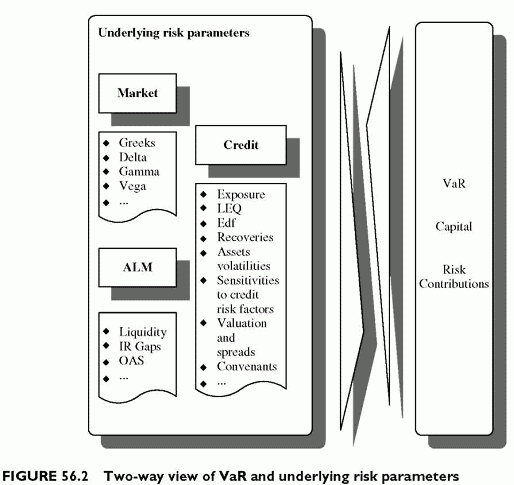
New measures require two-way processes for implementation. The power of VaR is in combining multiple measures into a single VaR figure. However, this single measure is not a substitute for all others. VaR solves the issue of quantifying the adequate capital. It also provides a single synthesis of multiple measures. The drawback is that it embeds many underlying sources of risk. Synthetic measures are convenient, but not fully explicit. Why is risk measured by allocated capital high or low for a particular segment? is not a simple question any more. How will end-users disentangle the components of risk? Without access to underlying sources of risk, it is not feasible to control VaR. It is not possible to hedge directly VaR. We can only hedge the underlying components. VaR-type measures of risk require a two-way implementation: from underlying parameters to VaR, and from VaR to the different sources of risk that they synthesize (Figure 56.2).
OLAP and data mining address these issues efficiently. OLAP allows us to view data along different angles or dimensions. Data mining, drilling-down and slicing risk data help to discern patterns in the data, for example into subsets of risk-return outliers. OLAP can store outputs of scenarios, or even run new scenarios in real time, making powerful what if functions available to end-users in the right reporting format allowing easy interpretation of the outputs. Embedding the risk information in the right architecture, with a number of preset interactive functions, is a prerequisite for making the risk management process a reality through adequate front-ends (Figure 56.3).


