Hierarchy of Key Indicators. Limits for key indicators. Data warehouse for key indicators
Category: Information Systems
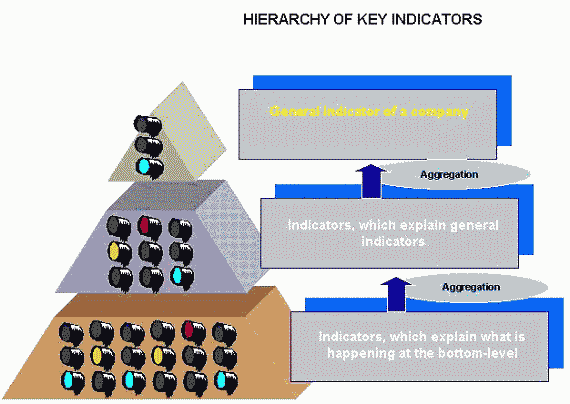
Hierarchy of Key Indicators
The list of key indicators is a hierarchy where information is aggregated from the lower level of detail into a limited number of general aggregated key indicators.
Hierarchy of key indicators
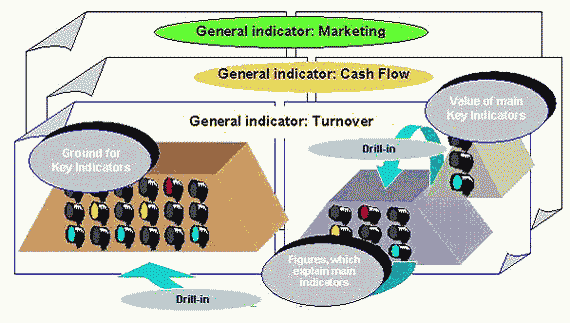
The example below shows the hierarchy of the key indicator «Marketing».
When defining a list of Key Indicators two conditions should be met:
the number of key indicators should be visually graspable. At the same time a user should have the opportunity to drill down into detail to see information which stands behind every indicator at a lower level.
Key indicators should be easy to calculate as frequently as required (for some indicators it is desirable to have a daily update) to provide managers with the opportunity for timely reaction to on-going events.
A general approach to definition of Key Indicators would typically include the following steps:
1. Select the most important global Key Indicators
2. Break them down by sub-indicators
3. Define the calculation rules
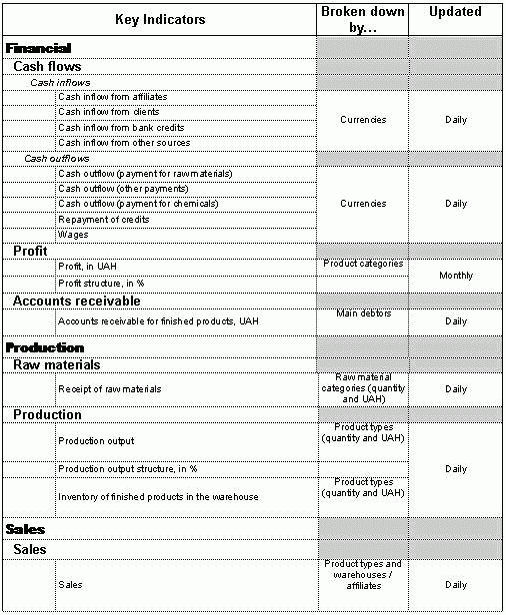
The table below shows a list of possible Key Indicators.
It is worth mentioning that the software tool ‘Key Indicators’ should allow change, addition and deletion of indicators. The list presented above can be changed according to the requirements of the company.
1.5 Limits for key indicators
To interpret correctly the meaning of an indicator, one should know whether the value of the indicator falls within set limits or whether it has positive or negative trends. For these purposes, three intervals for every indicator were defined:
Green interval («excellent»). If an indicator falls within this interval – it means that its actual value deviates positively.
Yellow interval («satisfactory»). If an indicator is within this interval – it means that its actual value is within the planned level.
Red interval («dangerous»). Should an indicator happen to be in this interval – it means a negative deviation of a parameter from its planned value.
Thus, an indicator is coloured with one of these colours (green, yellow or red) depending on the interval it falls in.
The system of limits defined in the software should be quite complicated. More detailed information on a system of limits for Key Indicators can be found in Key Indicator limit types.
The detailed budget of a company can be the ideal case to describe the limits of financial Key Indicators. A detailed budget should consist of:
a) Sales budget
b) Schedule of anticipated incoming cash flows from sales
c) Budget for sales expenses
d) Production budget
e) Production stock budget
f) Direct materials budget
g) Schedule of payments for purchased materials
h) Direct labour budget
i) Schedule of payments for direct labour
j) Budget for general production expenses
k) Budget for administrative costs
l) Forecast Profit and Loss Statement
m) Forecast Balance Sheet
n) Forecast Cash Flow Statement
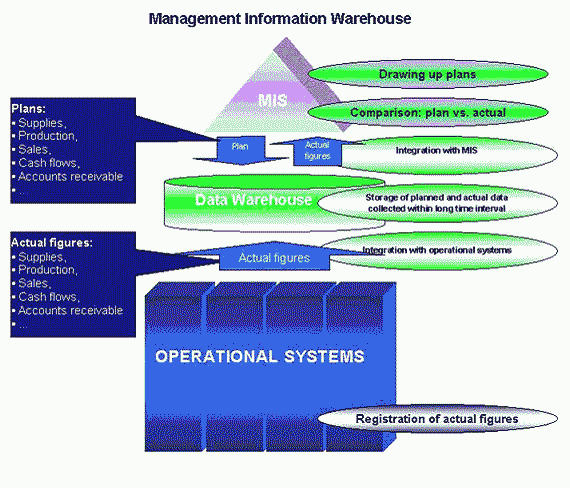
Management Information Warehouse


